From mid-2022, as interest rates climbed and borrowing capacities fell many expected house prices to follow suit, but home prices have proved resilient in the two years since interest rate tightening began.
Though, performance has diverged across the country. Interest rates began to quickly rise in May 2022, and after 425 basis points of tightening, national home prices have cycled through their 17th consecutive month of growth, now up 6.2% since May 2022.
While rising interest rates can lead to lower home prices as borrowing capacities reduce and servicing a mortgage becomes more expensive, like the mid and late-2000s, we’re now seeing that there are many other factors that determine the outcome for house prices aside from interest rates.
With the context of the economy that the reserve bank is tightening in also playing a role.

Resilient labour market conditions, strong population growth, tight rental markets, home equity gains, low stock on market and an undersupply of new homes have offset the significant reduction in borrowing capacities and deterioration in affordability that came with substantial interest rate tightening, keeping prices resistant to the falls the calculated shift in borrowing capacities would imply in many markets.
At the same time stock for sale has consistently shrunk in the top performing markets which has driven more competitive market conditions amid stronger demand and continued to fuel price rises in 2023 and 2024.
Since 1990, there has been only six periods when year-ended nominal home price growth has been negative. Those downturns have never been greater than 10% in year-ended terms and in every instance the drivers are broader than rates go up, prices go down.
As the four most recent instances of negative home price growth suggest, there are many other factors at play.

National home prices fell 3.8% from their March 2022 peak to trough as rate rises rebalanced the housing market from the extreme growth seen during the pandemic. However, in 2023, a housing supply shortfall matched by strong demand outweighed the impacts of higher borrowing costs and stretched affordability against the backdrop of resilient labour market conditions.
When home prices fell in 2018 the cash rate was steady; interest rates weren’t rising, but falls were driven by a credit squeeze as the cumulative effect of macroprudential measures reduced maximum borrowing amounts in a period of weak wages growth and a soft labour market. Price growth slowed and prices subsequently declined in 2018 and early 2019.
Following a tightening cycle from 2009-10 where interest rates rose 175bp in 14 months, home prices experienced small falls, with a peak to trough decline of just 2.6%. The Euro-zone debt crisis fallout, weak labour market outcomes and rise in interest rates weighed on buyer activity as housing affordability fell, rendering modest declines as part of an orderly correction. As interest rates fell in 2011-13 prices took off once again.
During the tightening cycle from 2006-08, home prices were also resilient to higher interest rates in an environment of low unemployment and above-target inflation, as has been the case over 2023-24.
Prices then continued to grow through this period despite modest falls during the global financial crisis, and as rates fell and affordability improved, prices quickly resumed growth.
Conventional wisdom says that as interest rates climb and borrowing capacities fall, house prices will follow suit. While interest rates and the subsequent reduction in borrowing capacities were the primary driver of home price falls seen for much of 2022, there are many other factors that determine the outcome for home prices.
Some of these include the supply of properties for sale, labour market conditions, the rate of immigration, the level of home building, the state of rental markets and government policy as well as the flows of interstate and regional migration.

While major shifts in monetary policy and the wider economic environment clearly influence house prices, recent market developments have highlighted that interest rates are not the only factor to affect home price growth.
In the two years since interest rates began to quickly climb in May 2022, the profound impact of supply and demand dynamics have outweighed the most substantial interest rate tightening on record and subsequent deterioration in affordability – now at its worst in at least three decades.
The context of the economic backdrop also matters.
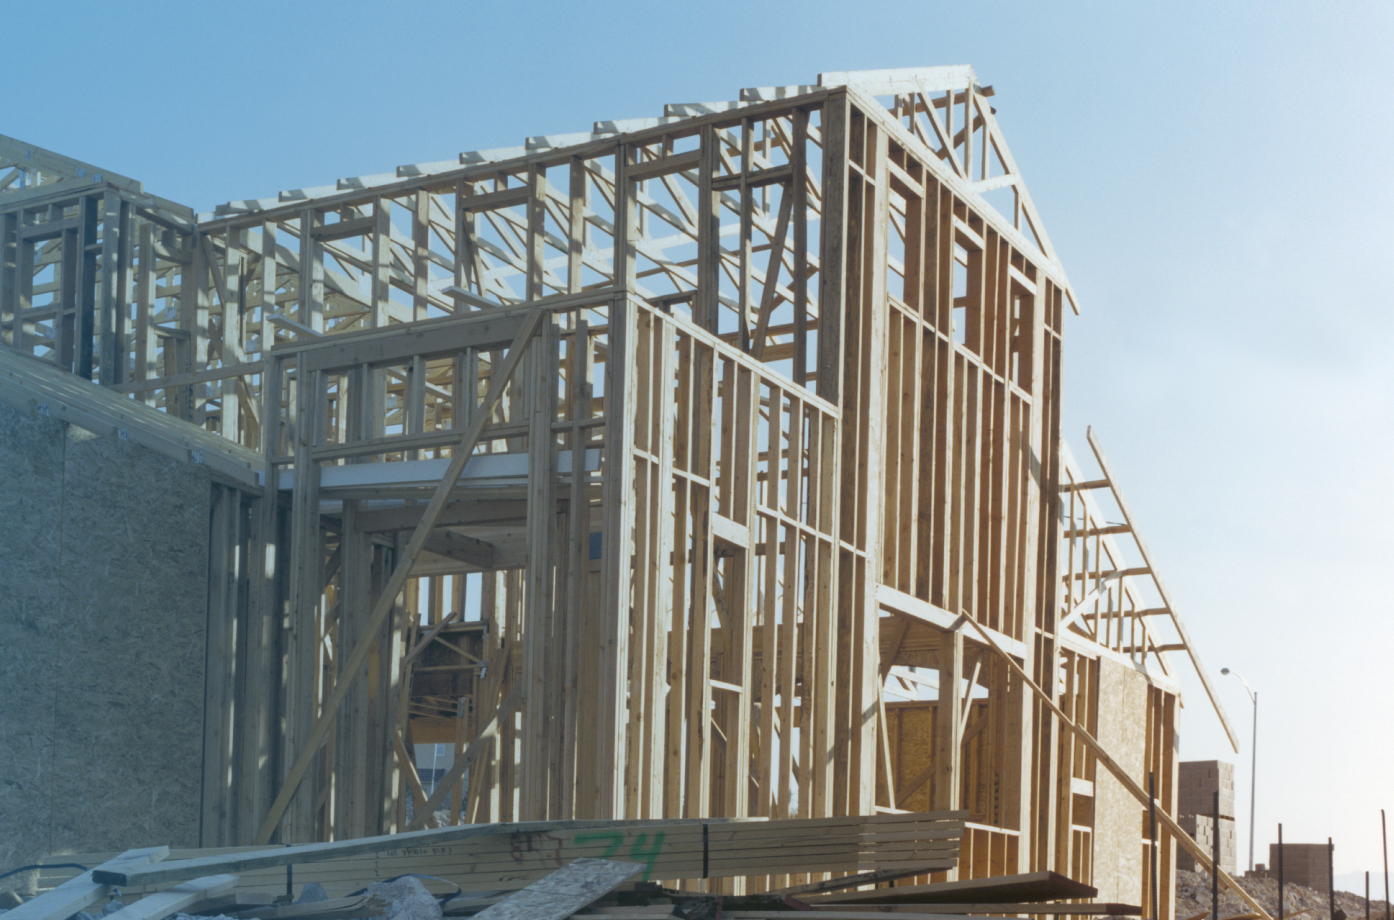
The fall in borrowing capacities influenced home prices in 2022 but by 2023 strong population growth, tight rental markets, resilient labour market conditions and home equity gains fuelled strong demand, while the supply side of the housing market fell short. Construction constraints and consequent tight housing supply relative to demand pushed home prices and rents to record highs.
Home prices have since remained resilient, negating the falls the calculated shift in borrowing capacities would imply, and this improvement in conditions has continued in 2024.