The PropTrack Home Price Index shows national home prices lifted 0.18% to a new peak in June, despite recording the slowest pace of monthly growth since December 2022.
With housing supply unable to meet demand, national home prices have cycled through 18 consecutive months of growth to hit a fresh peak in June despite the pace of growth slowing as winter begins.
More broadly, prices are up 10.14% from their December 2022 low, lifting 3.14% year-to-date to sit 6.55% above June 2023 levels.
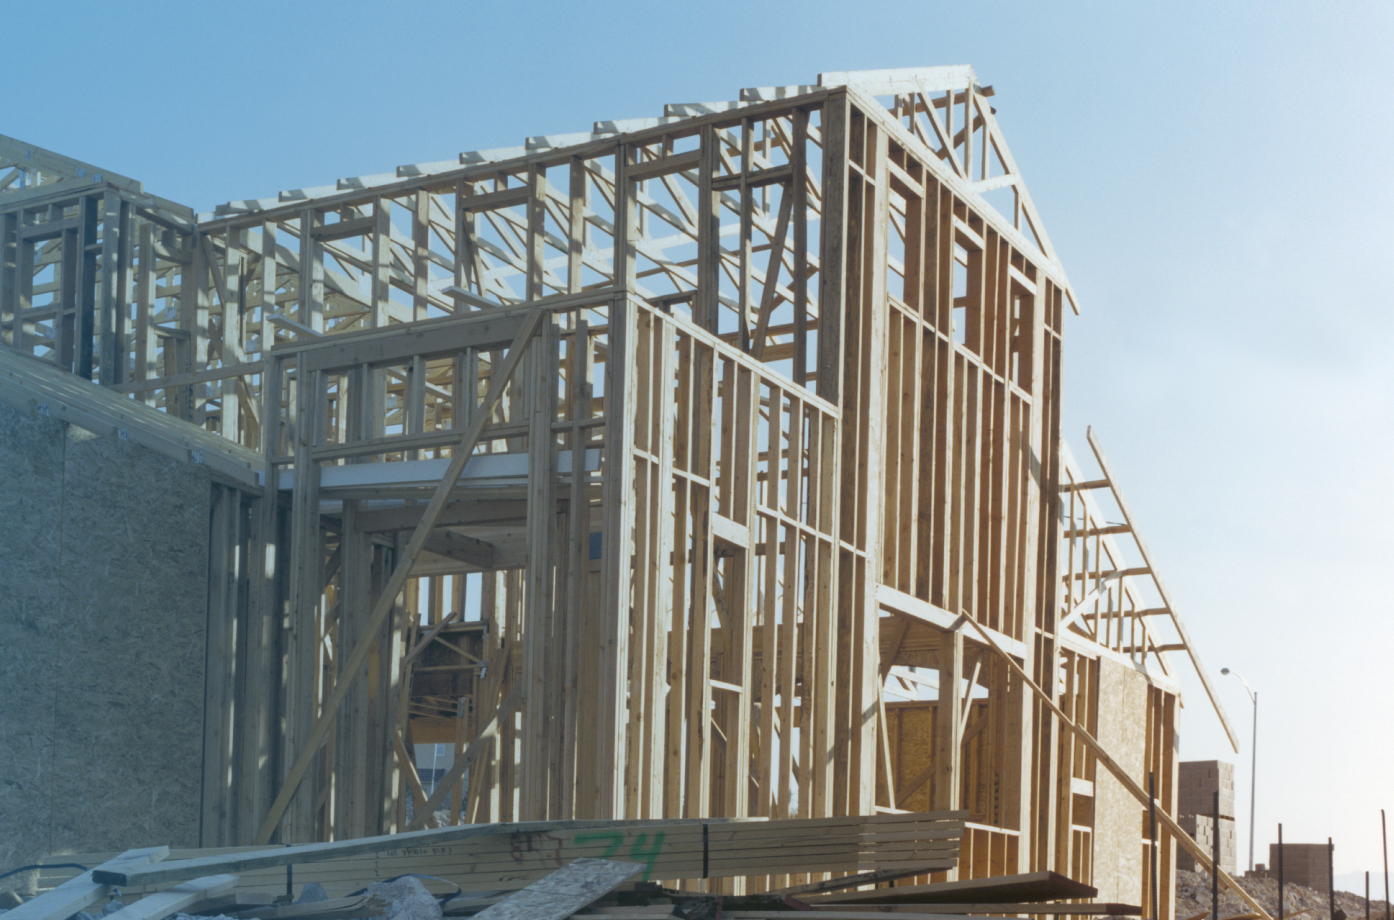
Although the number of homes hitting the market this year has lifted, strong population growth, tight rental markets and home equity gains continue to bolster demand. Meanwhile, building activity remains challenged, resulting in the chronic shortage of housing being exacerbated by a lack of new construction.
In 2024 interest rate stability has sustained buyer and seller confidence, while the continuous rise in home prices is motivating many to overcome affordability challenges and transact with the expectation of further growth.
As a result, demand is outpacing supply, pushing prices and rents higher and offsetting the higher interest rate environment.
Despite some easing in the rate of population growth and more stock on market, home prices are expected to lift further in the months ahead.
From July, tax cuts will lift household incomes increasing borrowing capacities and buyers’ budgets, further supporting price growth.
Although home prices are expected to rise in the coming months, they will likely maintain a slower pace through the seasonally quieter winter period, particularly with increasing uncertainty around the outlook for interest rates.
The smaller capital city markets, Perth, Adelaide, and Brisbane are likely to maintain their outperformance despite growth slowing as low stock levels intensify competition amid strong buyer demand.
• National home prices lifted 0.18% to a new peak in June, despite recording the slowest pace of monthly growth since December 2022. Prices are up 10.14% from their December 2022 low, lifting 3.14% year-to-date to sit 6.55% above June 2023 levels.
• Price growth slowed in the combined capital cities yet rose by 0.22% to reach a new peak in June, marking a 6.91% increase year-on-year. However, performance has varied as conditions differ across the capitals.
• Over the past quarter, every capital saw a slowdown in home price growth, as Perth (+0.65%), Brisbane (+0.50%) and Adelaide (+0.45%) recorded the strongest growth in June. Meanwhile Melbourne (-0.43%), Hobart (-0.21%), Darwin (-0.11%), and Canberra (-0.05%) were weakest, indicating mixed performance.
• Perth, Adelaide and Brisbane have recorded the fastest pace of growth for much of the past two years, with Perth prices up 22.52% in the past year, while Adelaide and Brisbane have grown 14.61% and 14.14% respectively.
• Capital city prices have outpaced regional areas over the past year and did so in June despite slowing growth. Prices in the combined regions rose 0.07% to be 5.61% above June 2023 levels, as regional WA (+0.59%) and regional Queensland (+0.24%) led growth in June.
National home prices increased for the 18th consecutive month lifting 0.18% in June as the home price upturn remains in play. However, the pace of growth has eased steadily since the end of the summer selling season.
Despite a rise in the number of homes for sale this year, strong population growth, tight rental markets, and home equity gains are all contributing to demand, whilst the supply side of the housing market has fallen short and as a result, home prices reached a fresh peak in June as robust demand has continued to push prices upwards.
The stable interest rate environment has also been a driver of confidence among buyers and sellers, while ongoing home price rises are likely incentivising many to overcome affordability challenges and transact with the expectation of further growth.
Capital city markets led 2023’s price resurgence while prices in regional areas were slower to recover.
This trend has continued in 2024 and capital cities continue to lead the home price upturn, with prices in the combined regional areas lifting a small 0.07% in June to be 5.61% above June 2023 levels, with regional WA (+0.59%) and regional Queensland (+0.24%) leading growth.
Home prices in the combined capital cities are up 3.40% year to date and up 6.91% year-on-year after climbing 0.22% in June to a fresh price peak. While prices in regional areas lifted 0.07% in June, they are now up 2.50% year to date and up 5.61% on June 2023 levels.
Over the past quarter, every capital saw a slowdown in home price growth and performance remains mixed across markets in June.
Throughout the past year smaller capitals have outperformed, and this trend persisted into June with Perth (+0.65%), Brisbane (+0.50%) and Adelaide (+0.45%) recording the strongest growth in June.
Meanwhile Melbourne (-0.43%), Hobart (-0.21%), Darwin (-0.11%), and Canberra (-0.05%) were weakest.
Perth has maintained its streak of relative outperformance and was the strongest market in the country for monthly (+0.65%) and annual (+22.52%) home price growth. Prices surged 0.65% in June marking the 24th consecutive month of growth.
Supporting home prices, buyers in Perth are facing close to record-low choice with total stock on market falling more than 20% over the past year. Although housing affordability has declined significantly as interest rates have risen, WA remains the most affordable state across Australia, which is likely supporting prices as well.
After Perth, Brisbane (+0.50%) and Adelaide (+0.45%) saw the strongest growth. In fact, Brisbane prices are now 19.96% above their December 2022 low, as a result Brisbane is now the second-most expensive capital outpacing Canberra and Melbourne, following this period of consistently strong growth. Prices in Brisbane reached a new peak June, although the pace of growth is slowing compared to earlier in the year.
Perth, Adelaide and Brisbane have recorded the fastest pace of growth for much of the past two years, with Perth prices up 22.52% in the past year, while Adelaide and Brisbane have grown 14.61% and 14.14% respectively.
The relative affordability of these cities homes, population growth, home equity gains and very tight rental markets are supporting home values, whilst low stock levels are intensifying competition amid strong buyer demand resulting in a sellers’ market with home prices continuing to rise at a fast pace in 2024.
Perth, Adelaide, and Brisbane have all experienced the largest falls in total listings over the past year amongst the capital cities.
In Sydney and Melbourne, a surge in selling activity has seen the flow of new listings hitting the market this year increasing, improving choice for buyers.
Despite the increase in new listings hitting the market in Sydney, buyer demand has kept up and Sydney home prices lifted 0.41% in June to a fresh price peak, bringing prices up 3.57% year-to-date.
Price growth has slowed over the past quarter in Sydney as home prices lifted 0.41% in June, the slowest pace of monthly growth since December 2023. Still, prices rose to a new peak, to sit 6.39% above June 2023 levels and 12.38% above their November 2022 low.
The increase in properties hitting the market this year has been met with strong demand, driving further price growth. However, the pace of growth has eased steadily since the end of the summer selling season as buyers enjoy more options.
Melbourne’s recovery has lagged Sydney and Brisbane, where prices fully recovered from 2022’s falls last year, and is now stalling with home prices falling for the past 3 months. Melbourne home prices fell 0.43% in June, the 3rd consecutive month of declines, leaving prices down 0.07% year-on-year. This is the slowest pace of annual growth since July 2023, and prices remain 3.89% below their March 2022 peak.
Price momentum is weaker in Melbourne as buyers have consistently enjoyed more choice relative to other markets, contributing to softer selling conditions. At the same time, construction rates relative to population growth in Victoria have been somewhat balanced compared to other parts of the country.
In May 2024 total listings in Melbourne were 24.7% higher than in March 2023, higher property taxes may be playing a part here. As a result, buyers in Melbourne have consistently enjoyed more choice relative to other markets with the total number of properties listed for sale sitting above the decade average since mid-2023, this is contributing to softer selling conditions with buyers likely having the upper hand. A reflection of the more balanced market conditions with buyers in Melbourne having much more choice than is typically the case.
Prices in Hobart have remained in a downturn for the past 27 months, falling a further 0.21% in June to sit 2.06% below levels seen this time last year. Hobart remains the weakest capital city market when comparing annual price growth (-2.06%), as well as the change from peak (-9.56%). However, this comes following a period of outperformance during the pandemic as well as strong growth in the years preceding. Home prices in Hobart are still up 34.2% since March 2020.
House prices have grown more quickly over the past year and are now 6.74% higher than a year ago, while unit prices are up 5.60% on their year ago levels.
This continues the trend seen throughout the pandemic - house values have experienced rapid growth up 47.67% on pre-pandemic levels, while the growth in unit values has been more moderate, up just 23.88% on pre-pandemic levels.
The growth in home values over the past few years has been a tale of a two-speed market and whilst typically houses command a premium over units, and over the long run houses tend to outperform units with respect to price growth, since the onset of the pandemic, house price outperformance reached historic extremes.
The impact of the pandemic on housing preferences played a part here.
In June prices for detached houses nationally grew 0.15% in the month whilst unit prices grew 0.33%. This growth brings house prices nationally up 3.14% year to date, with unit prices up 3.16%.
Housing affordability has deteriorated significantly as interest rates have risen and the apartment market offers a relative discount.
Strong demand for inner city living post-pandemic, coupled with the rapid rate of population growth and housing supply constraints alongside the relative value units offer are bolstering buyer demand and pricing in the apartment market, with unit price growth outperforming over the past quarter.
WA regions account for six of the top 10 fastest growing regions in the past year, with Northern Adelaide and parts of Brisbane making the remainder. Perth has been the strongest performing city – and indeed the strongest performing market overall – in the past year, and regional WA has been only just behind regional SA as the second-strongest regional market.
Home prices in 2023 remained resilient to the higher interest rate environment and this improvement in conditions that materialised in 2023 has continued in 2024.
The stable interest rate environment has likely been a driver of confidence among buyers and sellers, and with housing supply unable to meet demand across the country, home prices reached a fresh peak in June as robust demand has continued to push prices upwards.
Though in every capital city the pace of home price growth has slowed compared to earlier in the year.
Higher interest rates and inflation are squeezing household budgets, and the outlook for interest rates has become less certain, but property prices are expected to lift further in the months ahead, with housing demand buoyed by population growth, tight rental markets, and home equity gains.
Further, ongoing home price rises are likely incentivising many to overcome affordability challenges and transact with the expectation of continued growth.
Meanwhile, building activity remains challenged, resulting in the chronic shortage of housing being exacerbated by a lack of new construction.
As a result, demand is outpacing supply, pushing prices and rents higher and offsetting the higher interest rate environment.
Despite some easing in the rate of population growth and more stock on market, home prices are expected to lift further in the months ahead.
From July, tax cuts will lift household incomes increasing borrowing capacities and buyers’ budgets, further supporting price growth.
Although home prices are expected to rise in the coming months, they will likely maintain a slower pace through the seasonally quieter winter period, particularly with increasing uncertainty around the outlook for interest rates.
Performance has varied as conditions differ across the capitals, and this is expected to remain the case. The smaller capital city markets, Perth, Adelaide, and Brisbane are likely to maintain their outperformance despite growth slowing as low stock levels intensify competition amid strong buyer demand, while Hobart and Melbourne continue to see weaker price momentum.
Methodology: The PropTrack Home Price Index measures the monthly change in residential property prices across Australia to provide a current view on property market performance and trends. PropTrack Home Price Index uses a hybrid methodology combining repeat sales with hedonic regression. The repeat sales method matches resales of the same property while the hedonic regression estimates values based on the value of similar properties. The hybrid model allows two properties in the same Australian Bureau of Statistics Statistical Area 1 (SA1) region, of the same type, to be matched and controls for differences in property characteristics, as in a hedonic regression. The PropTrack Home Price Index is a revisionary index with the whole back history updated monthly with current transaction information.
** This report uses realestate.com.au internal data and data sourced from third parties, including State government agencies. It is current as at the time of publication. This report provides general information only and is not intended to constitute any advice and should not be relied upon as doing so. If you wish to cite or refer to this report (or any findings or data contained in it) in any publication, please refer to the report as the ’PropTrack Home Price Index Report – November 2023’. See report for Copyright and Legal Disclaimers.