National home values have now increased for 20 consecutive months, reaching a record high.
In August, home prices rose by 0.22% compared to the previous month and are now 6.16% higher than a year ago, the PropTrack Home Price Index shows.
The winter months are usually relatively quiet, but this year demand has been unseasonably high, resulting in more sales than last year.
The capital cities have experienced the most significant increase in values, with combined year-on-year growth now at 6.49%, marking an all-time high.

Prices in the combined regional areas rose 5.32% compared to August 2023, largely driven by robust growth in regional Western Australia and Queensland.
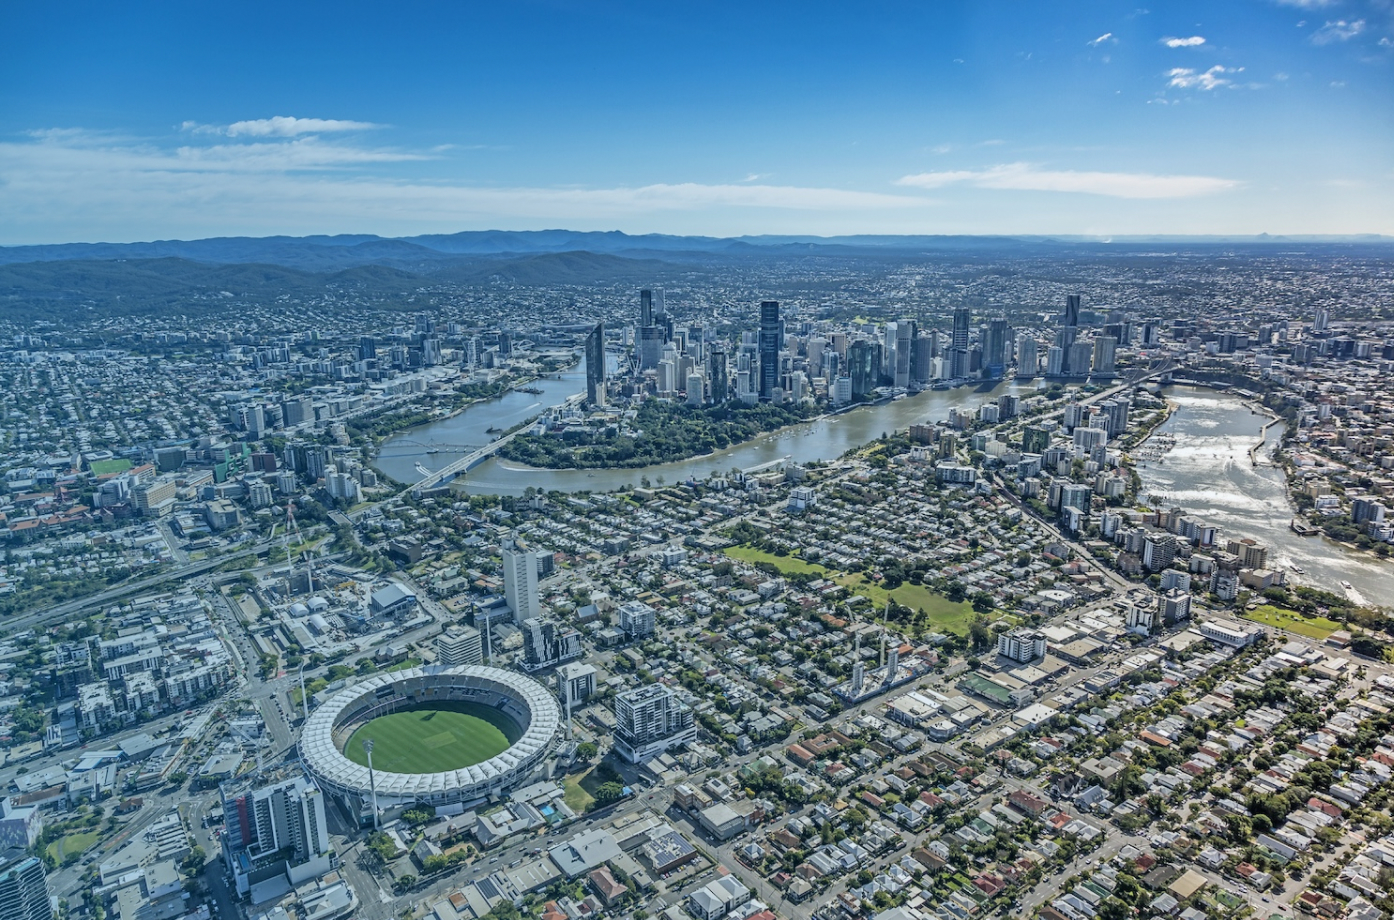
Perth and Adelaide topped the list of best-performing capital cities, with Brisbane ranking third, having year-on-year growth reaching 14%.
However, not all cities have performed as well.
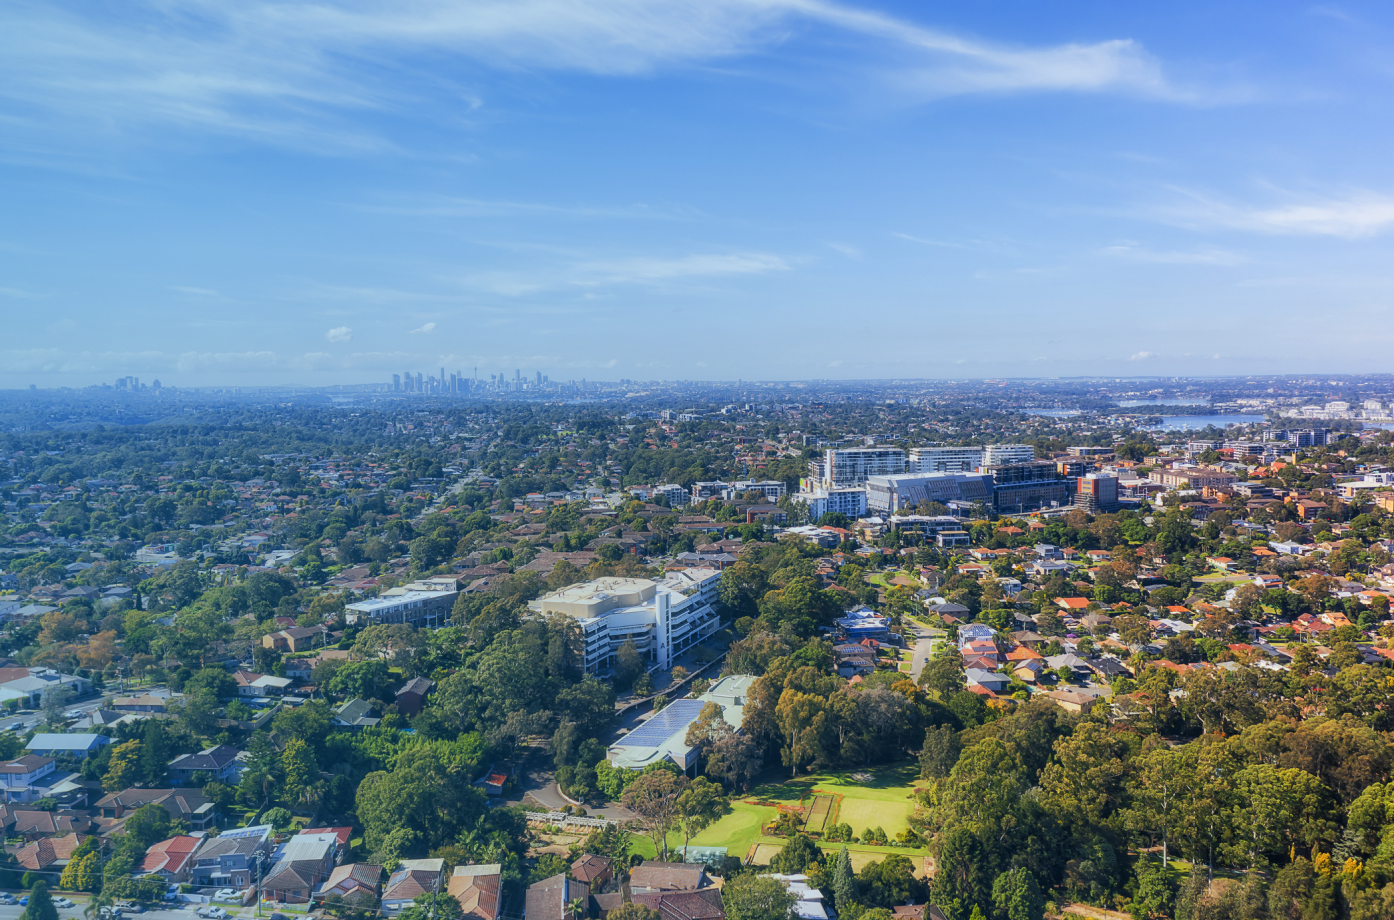
In Melbourne, home prices declined again in August, marking the fifth consecutive month of drops, with prices declining 1.98% over that period.
Year-on-year, prices also decreased, leaving Melbourne 4.7% below its March 2022 peak.
Hobart recorded a year-on-year decline of 0.5% and is down 8.2% from its previous peak.
Melbourne and Hobart were the only cities with year-on-year price drops in August. However, Darwin and Canberra also remain below previous highs.

Regional markets present a mixed bag, with some areas performing strongly while others lag behind.
Regional Western Australia and Queensland have experienced significant year-on-year growth, up by 14.9% and 11.3%, respectively.
Values in regional South Australia grew 9.3% year-on-year, and regional New South Wales recorded a 3.9% rise in prices.
Although growth in NSW isn't on par with WA and QLD, all three regional areas are at record highs, with regional SA not far behind.
The local areas with the largest growth are understandably in the cities and regions that have seen the largest price rises.
Six of the ten areas with the largest year-on-year growth were in Western Australia – five in Perth and one in Bunbury, a regional area.

Only three of the top ten were regional areas, including the aforementioned Bunbury, Townsville, and Central Queensland.
Underperforming areas were primarily in Victoria, except for one region in the Northern Territory.
Geelong in regional Victoria experienced a year-on-year decrease of 3.9%, closely followed by the Mornington Peninsula and Ballarat.
In Melbourne, the west and inner-city areas had the largest price drops, decreasing by 2.1% and 1.9% respectively.

The varying price growth rates across cities and regions indicate a multi-speed market influenced by numerous factors.
These include higher interest rates, the volume of listings on the market, demand for housing, new developments, and investor activity.
The strong winter selling season has boosted buyer and seller sentiment, with recent tax cuts providing additional financial relief to buyers.
Home prices are expected to rise further as we progress into spring. However, the anticipated increase in stock, uncertainty around the timing of interest rate cuts, and affordability constraints are likely to slow the pace of price growth compared to the faster rate observed in the first quarter of this year.